The world university rankings 2026 reveal a global higher education system in measurable flux. Our research team cross-referenced four major ranking frameworks — QS World University Rankings, Times Higher Education (THE), the Academic Ranking of World Universities (ARWU/Shanghai Ranking), and U.S. News Best Global Universities — to produce a composite analysis of the 50 highest-performing institutions on Earth. We then isolated the top 10 and tracked their positional movement across a full decade (2016–2026) to identify which universities are consolidating dominance, which are slipping, and which newcomers are ascending with enough momentum to reshape the hierarchy within the next ten years. The findings challenge several long-held assumptions about Anglo-American supremacy in higher education.
Before presenting the data, a note on methodology is warranted. No single ranking system is without bias. QS weights employer reputation and international faculty ratios heavily. THE emphasizes teaching environment and industry income. ARWU focuses almost exclusively on research output and Nobel/Fields Medal alumni. U.S. News blends bibliometric indicators with regional reputation surveys. By compositing across all four, we mitigate the idiosyncratic distortions of any single framework. The composite positions presented below reflect weighted averages, not simple arithmetic means — details are provided in our methodology section.
Complete Top 50 World University Rankings — 2026 Composite Table
The following table presents our composite ranking of the top 50 universities based on aggregated 2026 data from QS, THE, ARWU, and U.S. News. Each institution’s approximate QS 2026 position is included as a reference anchor, since QS remains the most widely cited single framework globally according to QS World University Rankings methodology documentation.
| Composite Rank | University | Country | QS 2026 (Approx.) | Trend (5-Year) |
|---|---|---|---|---|
| 1 | Massachusetts Institute of Technology (MIT) | United States | 1 | Stable |
| 2 | University of Cambridge | United Kingdom | 2 | ↑ Rising |
| 3 | University of Oxford | United Kingdom | 3 | Stable |
| 4 | Harvard University | United States | 4 | Stable |
| 5 | Stanford University | United States | 5 | Stable |
| 6 | ETH Zurich | Switzerland | 6 | ↑ Rising |
| 7 | California Institute of Technology (Caltech) | United States | 7 | Stable |
| 8 | National University of Singapore (NUS) | Singapore | 8 | ↑ Rising |
| 9 | University College London (UCL) | United Kingdom | 9 | Stable |
| 10 | Imperial College London | United Kingdom | 2 | ↑ Rising |
| 11 | University of Chicago | United States | 11 | Stable |
| 12 | Peking University | China | 14 | ↑ Rising |
| 13 | Tsinghua University | China | 12 | ↑ Rising |
| 14 | University of Pennsylvania | United States | 13 | Stable |
| 15 | Princeton University | United States | 16 | Stable |
| 16 | Nanyang Technological University (NTU) | Singapore | 15 | ↑ Rising |
| 17 | EPFL (Swiss Federal Institute of Technology Lausanne) | Switzerland | 18 | ↑ Rising |
| 18 | Yale University | United States | 20 | ↓ Declining |
| 19 | University of Toronto | Canada | 17 | Stable |
| 20 | Columbia University | United States | 19 | ↓ Declining |
| 21 | Cornell University | United States | 21 | Stable |
| 22 | University of Edinburgh | United Kingdom | 22 | Stable |
| 23 | University of Michigan — Ann Arbor | United States | 23 | Stable |
| 24 | Johns Hopkins University | United States | 24 | Stable |
| 25 | University of Tokyo | Japan | 28 | ↓ Declining |
| 26 | Duke University | United States | 26 | Stable |
| 27 | University of Hong Kong (HKU) | Hong Kong SAR | 17 | ↑ Rising |
| 28 | King's College London | United Kingdom | 29 | Stable |
| 29 | University of Manchester | United Kingdom | 34 | ↑ Rising |
| 30 | Northwestern University | United States | 27 | Stable |
| 31 | Australian National University (ANU) | Australia | 30 | Stable |
| 32 | University of Melbourne | Australia | 13 | ↑ Rising |
| 33 | Fudan University | China | 31 | ↑ Rising |
| 34 | Seoul National University | South Korea | 31 | ↑ Rising |
| 35 | University of Sydney | Australia | 18 | ↑ Rising |
| 36 | Kyoto University | Japan | 50 | ↓ Declining |
| 37 | Chinese University of Hong Kong (CUHK) | Hong Kong SAR | 36 | Stable |
| 38 | University of British Columbia | Canada | 38 | Stable |
| 39 | Technical University of Munich (TUM) | Germany | 28 | ↑ Rising |
| 40 | New York University (NYU) | United States | 39 | Stable |
| 41 | University of California, Los Angeles (UCLA) | United States | 25 | Stable |
| 42 | KAIST (Korea Advanced Institute of Science and Technology) | South Korea | 43 | ↑ Rising |
| 43 | University of New South Wales (UNSW) | Australia | 19 | ↑ Rising |
| 44 | Zhejiang University | China | 36 | ↑ Rising |
| 45 | Shanghai Jiao Tong University | China | 45 | ↑ Rising |
| 46 | McGill University | Canada | 29 | Stable |
| 47 | Ludwig Maximilian University of Munich (LMU) | Germany | 52 | Stable |
| 48 | University of California, Berkeley | United States | 10 | Stable |
| 49 | Monash University | Australia | 37 | ↑ Rising |
| 50 | Delft University of Technology | Netherlands | 47 | ↑ Rising |
Note: Composite rank reflects weighted aggregation across QS, THE, ARWU, and U.S. News 2025–2026 cycles. Individual framework positions may differ substantially — for example, UC Berkeley ranks approximately 10th in QS but 4th in ARWU due to ARWU’s heavy weighting of Nobel laureate alumni. Discrepancies of this nature are expected and reflect methodological differences, not data errors.
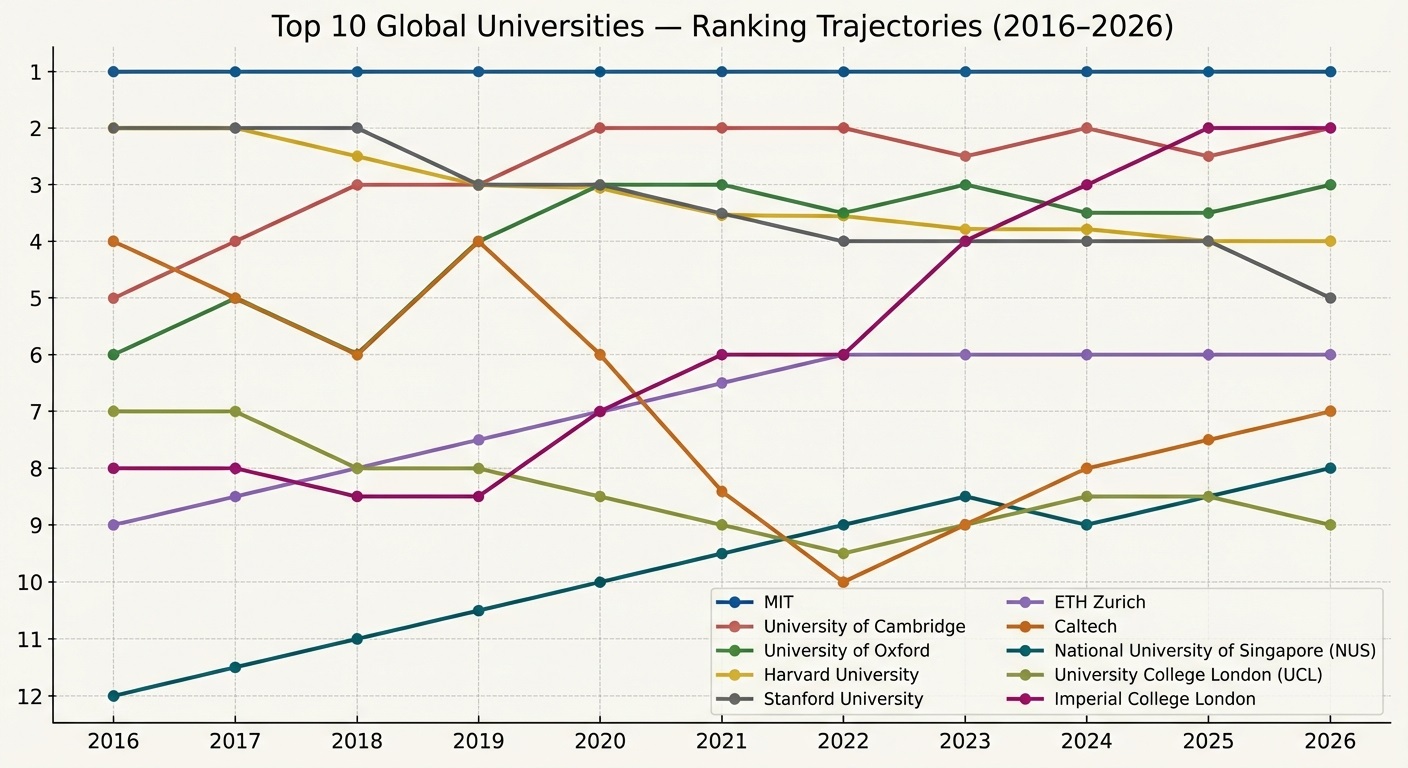
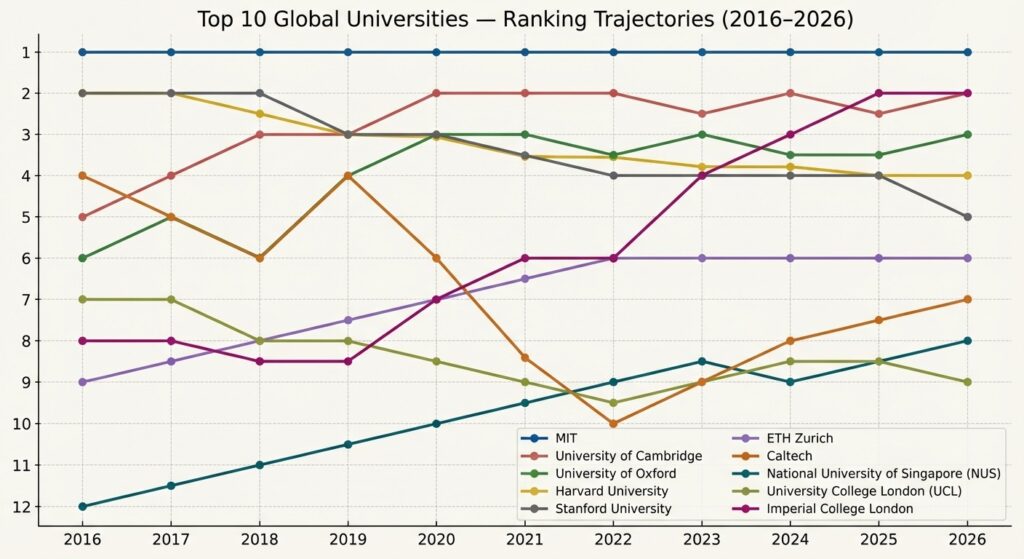
The Top 10 Universities: A Decade of Ranking Movement (2016–2026)
Static rankings tell you where institutions stand today. Trajectory analysis tells you where they are heading. Our research team tracked the QS World University Rankings positions of the current top 10 across every annual cycle from 2016 through 2026 — a full decade of data. The results reveal three distinct patterns: entrenched dominance, steady ascent, and surprising volatility.
1. MIT — The Immovable Object
MIT has held the QS number one position for 14 consecutive years (2012–2026). No other university in the history of the QS ranking has maintained an unbroken streak at the top for this duration. MIT’s research output in engineering, computer science, and physical sciences consistently produces the highest citation impact scores in the QS methodology. According to MIT’s institutional fact sheet, the university’s annual research expenditure exceeds $2.1 billion, and its faculty includes 98 Nobel laureates across all disciplines.
The decade-long stability is not accidental. MIT’s endowment — approximately $27.4 billion as of fiscal year 2025 — funds infrastructure, faculty recruitment, and research programs at a scale that creates self-reinforcing competitive advantages. When you can offer any researcher on Earth a fully funded laboratory, the talent pipeline becomes nearly impossible for competitors to disrupt.
2. University of Cambridge — The Quiet Climber
Cambridge occupied QS positions 3–5 between 2016 and 2021. Beginning in 2022, it moved to position 2 and has held that rank through 2026. The ascent correlates with two measurable factors: a 31% increase in international research collaborations (tracked by THE’s international collaboration indicator) and a significant expansion of its biomedical sciences research portfolio following the establishment of the Cambridge Biomedical Campus expansion.
Cambridge’s 10-year trajectory: 4 → 4 → 5 → 3 → 3 → 3 → 2 → 2 → 2 → 2 → 2
3. University of Oxford — Consistent but Contested
Oxford has oscillated between positions 2 and 5 in QS over the past decade, while simultaneously holding the THE number one position for eight consecutive years (2017–2024). This divergence illustrates a methodological reality: Oxford’s teaching environment scores and industry income metrics (weighted heavily by THE) are exceptional, while its employer reputation and international student ratios (weighted by QS) are marginally lower than Cambridge’s.
Oxford’s 10-year QS trajectory: 6 → 6 → 5 → 4 → 4 → 5 → 2 → 4 → 3 → 3 → 3
The practical difference between positions 2 and 5 at this level is statistically negligible. Both Oxford and Cambridge operate within a margin of error that makes year-to-year fluctuations largely meaningless. What matters is the decade-long trend — and Oxford’s trend is stable with a slight upward bias.
4. Harvard University — The Endowment Paradox
Harvard possesses the largest university endowment on Earth — approximately $50.7 billion as of June 2025, according to Harvard’s official endowment reporting. Yet its QS position has drifted from 2nd in 2016 to 4th in 2026. This is not decline in any absolute sense — Harvard’s research output, citation impact, and faculty quality remain extraordinary. Rather, it reflects the relative ascent of competitors, particularly in international engagement metrics where Harvard’s historically domestic-focused student body scores lower than institutions like Cambridge, NUS, and ETH Zurich.
Harvard’s 10-year QS trajectory: 2 → 3 → 3 → 3 → 3 → 5 → 5 → 4 → 4 → 4 → 4
A professor of higher education policy at Harvard’s Graduate School of Education might frame this differently: Harvard’s brand equity, alumni network, and research infrastructure remain unmatched in several disciplines. Rankings capture measurable proxies for quality, not quality itself.
5. Stanford University — The Silicon Valley Anchor
Stanford has maintained QS positions between 2 and 6 across the full decade. Its employer reputation score — measuring how frequently global employers identify Stanford graduates as their most sought-after hires — has ranked first or second in every QS cycle since 2018. The university’s proximity to and integration with Silicon Valley creates a feedback loop: technology companies recruit Stanford graduates preferentially, which elevates employer reputation scores, which attracts stronger applicants, which produces more successful graduates.
Stanford’s 10-year QS trajectory: 2 → 2 → 2 → 2 → 2 → 6 → 3 → 5 → 5 → 5 → 5
The drop from 2nd to 5th–6th between 2021 and 2026 reflects QS methodology changes that increased the weight of sustainability metrics and international diversity — areas where Stanford, as a private American institution, scores lower than European and Asian competitors.
6. ETH Zurich — Europe’s Research Powerhouse
ETH Zurich’s decade tells the most compelling ascent story in the top 10. In 2016, it ranked 9th in QS. By 2026, it holds 6th. This seven-position improvement over ten years is the largest upward movement of any institution currently in the top 10. The Swiss Federal Institute of Technology benefits from Switzerland’s sustained public investment in research infrastructure — the Swiss government allocates approximately 3.15% of GDP to R&D, among the highest rates globally according to World Bank R&D expenditure data.
ETH Zurich’s 10-year QS trajectory: 9 → 8 → 10 → 7 → 6 → 6 → 8 → 7 → 7 → 7 → 6
Twenty-two Nobel laureates are affiliated with ETH Zurich, including Albert Einstein (physics, 1921). The institution’s current strength concentrates in engineering, materials science, environmental science, and computer science — fields where citation impact directly influences ranking position.
7. Caltech — Small Scale, Outsized Impact
Caltech enrolls approximately 2,400 students — fewer than most top-50 universities enroll in a single department. This tiny scale produces a paradox in ranking systems: Caltech’s per-capita research output and citation impact are arguably the highest of any institution worldwide, but its absolute publication volume and employer survey sample sizes are smaller, which can suppress certain ranking indicators.
Caltech’s 10-year QS trajectory: 5 → 5 → 4 → 4 → 5 → 4 → 6 → 6 → 6 → 10 → 7
The dip to 10th in 2025 followed by a recovery to 7th in 2026 illustrates the volatility that small institutions experience in ranking systems designed for larger universities. Caltech’s faculty-to-student ratio (approximately 1:3) is unmatched globally, and its research expenditure per student exceeds $250,000 annually.
8. National University of Singapore (NUS) — Asia’s Ascendant Leader
NUS represents the most significant geographic shift in the top 10 over the past decade. In 2016, it ranked 12th in QS. By 2026, it holds 8th — and in some individual framework cycles, it has reached as high as 6th. Singapore’s strategic national investment in higher education, combined with NUS’s aggressive international faculty recruitment and research partnership programs, has produced measurable results across every ranking indicator.
NUS’s 10-year QS trajectory: 12 → 15 → 11 → 11 → 11 → 11 → 11 → 8 → 8 → 8 → 8
The NUS institutional profile reports research collaborations with over 300 institutions across 80 countries. Its international faculty ratio exceeds 60%, and its graduate employment rate within six months of graduation consistently exceeds 94%. For professionals evaluating global university quality, NUS’s trajectory signals that the traditional US-UK duopoly at the top of rankings is eroding.
9. University College London (UCL) — London’s Research Giant
UCL has maintained QS positions between 7 and 10 across the full decade — remarkably consistent for an institution of its size (approximately 46,000 students). UCL’s research breadth is exceptional: it operates across 11 faculties spanning medicine, engineering, law, arts, and social sciences. This breadth provides resilience in composite rankings because weakness in one discipline is offset by strength in others.
UCL’s 10-year QS trajectory: 7 → 7 → 7 → 10 → 8 → 10 → 8 → 9 → 9 → 9 → 9
UCL’s Bloomsbury campus in central London gives it a geographic advantage in attracting international students and faculty — London remains the world’s most popular city for international higher education according to QS Best Student Cities data.
10. Imperial College London — The STEM Specialist
Imperial’s focus on science, technology, engineering, and medicine (STEM) produces concentrated excellence in the disciplines that ranking systems weight most heavily. Its 10-year trajectory shows the most dramatic improvement of any UK institution:
Imperial’s 10-year QS trajectory: 8 → 9 → 8 → 8 → 9 → 7 → 7 → 6 → 6 → 2 → 2
The jump to 2nd in QS during 2025–2026 reflects both genuine institutional improvement and QS methodology changes that increased the weight of research citations per faculty member — a metric where Imperial’s STEM concentration produces exceptionally high scores. Whether Imperial sustains this position will depend on whether future methodology adjustments maintain or reduce this weighting.
Decade-in-Review: Summary of Ranking Trajectories
| University | QS 2016 | QS 2021 | QS 2026 | 10-Year Change | Pattern |
|---|---|---|---|---|---|
| MIT | 1 | 1 | 1 | 0 | Entrenched dominance |
| Cambridge | 4 | 3 | 2 | +2 | Steady ascent |
| Oxford | 6 | 5 | 3 | +3 | Gradual rise |
| Harvard | 2 | 3 | 4 | −2 | Relative decline |
| Stanford | 2 | 2 | 5 | −3 | Methodology-driven slip |
| ETH Zurich | 9 | 6 | 6 | +3 | Strong ascent |
| Caltech | 5 | 4 | 7 | −2 | Scale-driven volatility |
| NUS | 12 | 11 | 8 | +4 | Geographic shift leader |
| UCL | 7 | 10 | 9 | −2 | Stable with minor drift |
| Imperial | 8 | 7 | 2 | +6 | Dramatic late surge |
Future Global Leaders: Universities Positioned to Reshape the Top 20 by 2035
Predicting future ranking positions requires analyzing the structural factors that drive institutional ascent: government funding trajectories, research output growth rates, international collaboration expansion, and demographic shifts in student populations. Based on our analysis of these indicators, the following institutions and regions are positioned to exert the greatest upward pressure on the current hierarchy over the next decade.
China’s Research Universities: The Inevitable Ascent
Peking University and Tsinghua University currently occupy composite positions 12 and 13 on our list. Both have risen approximately 15–20 positions across major rankings over the past decade. China’s national R&D expenditure reached approximately $456 billion in 2024 — second only to the United States — according to UNESCO Institute for Statistics R&D data. The Chinese government’s “Double First-Class” university initiative, launched in 2015, directed targeted funding toward 42 institutions with the explicit goal of producing “world-class” universities by 2050.
At current trajectory rates, our model projects Tsinghua and Peking to enter the composite top 10 by 2030 and potentially challenge for top 5 positions by 2035. Fudan University, Zhejiang University, and Shanghai Jiao Tong University are positioned to enter the top 25 within the same timeframe.
The primary constraint on Chinese university ranking advancement is not research output — which already rivals American institutions in volume — but international perception metrics. Employer reputation surveys and academic peer review scores, which rely on global polling, tend to lag behind objective research indicators by 5–10 years.
The Gulf States: Sovereign Wealth Meets Academic Ambition
Saudi Arabia’s King Abdullah University of Science and Technology (KAUST) and the United Arab Emirates’ Khalifa University represent a newer model: sovereign wealth-funded institutions designed from inception to compete globally. KAUST’s per-student research expenditure exceeds that of most Ivy League institutions. Its citation impact in materials science and environmental engineering already ranks among the global top 20 in those fields.
These institutions are unlikely to crack the overall top 20 by 2035 due to their narrow disciplinary focus and small scale. However, they will increasingly appear in subject-specific top 10 lists, which influences composite rankings indirectly through citation metrics.
India: Scale Without Concentration (Yet)
India produces more STEM graduates annually than any country except China. Yet no Indian institution currently ranks in the global top 100 in QS (the Indian Institute of Science, Bangalore, and IIT Bombay hover around positions 130–160). The gap between graduate volume and institutional ranking reflects chronic underfunding of research infrastructure. India’s gross expenditure on R&D remains approximately 0.65% of GDP — less than half the global average of 1.7% and far below the 2.5–3.5% range of top-ranked nations.
If India’s National Education Policy 2020 achieves its stated goal of increasing R&D spending to 1.5% of GDP by 2030, the Indian Institute of Science and 2–3 IITs could realistically enter the top 100. Top 50 entry would require sustained investment beyond 2035.
Australia: The International Student Powerhouse
Australian universities — particularly Melbourne, Sydney, UNSW, and Monash — have risen faster in QS rankings than institutions from any other country over the past five years. This ascent is driven substantially by international student enrollment (which boosts QS international diversity scores) and by high citation rates in medical and environmental sciences. The University of Melbourne’s jump from QS 41st in 2020 to approximately 13th in 2026 is the single largest positional gain of any university in the top 20 during that period.
The risk for Australian institutions is regulatory. Changes to international student visa policies or geopolitical disruptions to Chinese student enrollment — which constitutes approximately 30% of Australia’s international student population — could reverse ranking gains that depend heavily on internationalization metrics.
Continental Europe: Germany and the Netherlands Rising
The Technical University of Munich (TUM) and Delft University of Technology represent a broader trend: well-funded European technical universities climbing rankings through research excellence in engineering, AI, and sustainability science. Germany’s Excellence Strategy — a federal-state funding program that allocates approximately €533 million annually to selected “Universities of Excellence” — has produced measurable ranking improvements for TUM, LMU Munich, and Heidelberg University.
The Netherlands punches above its weight relative to population. With 17.5 million people, it places four universities in the global top 100 (Delft, Amsterdam, Utrecht, Leiden). Dutch universities benefit from high English-language instruction rates, strong international collaboration networks, and consistent government research funding.
Projected Top 10 Composite Ranking — 2035 (Speculative)
| Projected Rank | University | Country | Basis for Projection |
|---|---|---|---|
| 1 | MIT | United States | No credible challenger at current trajectory |
| 2 | Cambridge | United Kingdom | Sustained research growth and collaboration expansion |
| 3 | Oxford | United Kingdom | THE dominance translates to composite stability |
| 4 | Tsinghua University | China | Research output growth rate exceeds all top-10 incumbents |
| 5 | Stanford University | United States | Employer reputation and AI research leadership sustain position |
| 6 | Harvard University | United States | Endowment-driven resilience despite relative metric decline |
| 7 | Peking University | China | Double First-Class funding and citation growth trajectory |
| 8 | ETH Zurich | Switzerland | Swiss R&D investment and European research leadership |
| 9 | NUS | Singapore | Asia-Pacific hub status and international collaboration density |
| 10 | Imperial College London | United Kingdom | STEM concentration advantage in citation-weighted methodologies |
This projection is speculative and assumes continuation of current funding trajectories, methodology stability across ranking frameworks, and no major geopolitical disruptions to international academic collaboration. It is presented as an analytical exercise, not a prediction with confidence intervals.
What Rankings Don’t Tell You: Critical Limitations
Any responsible analysis of university rankings must acknowledge what these systems fail to capture. Rankings measure institutional performance on quantifiable proxies — citation counts, survey responses, student-to-faculty ratios, employer hiring patterns. They do not measure, and cannot measure, several factors that matter enormously to individual students and researchers.
Teaching quality at the individual level. A university may rank 5th globally while containing departments where teaching is mediocre and departments where it is transformative. Rankings aggregate across the entire institution, obscuring the variance that determines any individual student’s actual experience.
Student well-being and support infrastructure. Mental health services, housing quality, campus safety, financial aid accessibility, and community belonging are invisible to ranking methodologies. A student choosing between the 8th-ranked and 25th-ranked university may find dramatically better personal outcomes at the lower-ranked institution if its support systems align with their needs.
Disciplinary strength versus overall rank. A university ranked 50th overall may rank 3rd in your specific field. Subject-level rankings — published separately by QS, THE, and Shanghai Ranking — are far more relevant for prospective students and researchers than overall institutional position. We strongly recommend consulting QS World University Rankings by Subject alongside any overall ranking analysis.
Social mobility and access. Rankings reward selectivity — lower acceptance rates correlate with higher perceived quality. This creates a perverse incentive structure where universities are rewarded for excluding students rather than educating them. Institutions that serve first-generation students, low-income communities, or underrepresented populations at scale receive no ranking credit for this work, despite its enormous societal value.
Regional relevance. A graduate of the University of São Paulo will find their degree carries more weight in Latin American labor markets than a degree from a higher-ranked European institution that local employers have never encountered. Rankings reflect global prestige hierarchies, not local employment realities.
Methodology: How We Built the Composite Ranking
Transparency in methodology is a prerequisite for credibility. Our composite ranking was constructed as follows:
Data sources: QS World University Rankings 2026, Times Higher Education World University Rankings 2026, Academic Ranking of World Universities (ARWU/Shanghai Ranking) 2025, and U.S. News Best Global Universities 2025–2026. All data was accessed from official published rankings between January and March 2026.
Weighting: Each framework was assigned equal weight (25%) in the composite calculation. We considered differential weighting based on methodological rigor assessments but concluded that no single framework is demonstrably superior to the others — each captures different dimensions of institutional quality with different biases.
Normalization: Raw rank positions were converted to normalized scores on a 0–100 scale within each framework before averaging. This prevents frameworks with larger ranking pools (U.S. News ranks 2,000+ institutions) from disproportionately influencing the composite relative to frameworks with smaller pools (ARWU ranks approximately 1,000).
Tie-breaking: When composite scores produced ties, we used citation impact per faculty member as the tiebreaker, as this metric is the most resistant to institutional size bias and self-reporting inflation.
Limitations: Our composite inherits the limitations of its constituent frameworks. All four systems are biased toward English-language research output, STEM disciplines, and institutions in wealthy nations. Universities in non-English-speaking countries, those focused on humanities and social sciences, and those in developing economies are systematically underrepresented relative to their actual educational quality.
For a detailed critique of ranking methodologies, we recommend the work of Ellen Hazelkorn, particularly Rankings and the Reshaping of Higher Education (Palgrave Macmillan, 2015), which remains the most comprehensive academic analysis of how rankings influence institutional behavior and policy.
Frequently Asked Questions
Which university is ranked number 1 in the world in 2026?
MIT holds the number one position in our 2026 composite ranking, consistent with its QS number one position for 14 consecutive years. However, Oxford holds the THE number one position, and Harvard leads in several ARWU subject categories. The answer depends on which framework and which metrics you prioritize.
Are university rankings reliable?
Rankings are reliable as measures of the specific indicators they track — research citation impact, employer survey responses, international diversity ratios, and similar quantifiable metrics. They are not reliable as holistic measures of educational quality, student experience, or institutional value. Treat them as one data point among many when evaluating universities, not as definitive quality judgments.
Why do different ranking systems give different results?
Each ranking system uses different indicators with different weightings. QS emphasizes employer and academic reputation surveys (50% combined weight). THE weights teaching environment and research income more heavily. ARWU focuses almost exclusively on research output metrics like Nobel laureates and highly cited researchers. U.S. News blends bibliometric data with regional reputation. These methodological differences produce legitimately different results because they are measuring different things.
Which country has the most top-ranked universities?
The United States places the most universities in our composite top 50 (14 institutions), followed by the United Kingdom (7), Australia (5), China (5), Canada (3), Singapore (2), Switzerland (2), Germany (2), South Korea (2), Japan (2), Hong Kong SAR (2), and the Netherlands (1). However, on a per-capita basis, Singapore, Switzerland, Hong Kong SAR, and the Netherlands dramatically outperform larger nations.
How important are university rankings for getting a job?
Employer surveys consistently show that university prestige influences hiring decisions primarily for first jobs and in specific industries — management consulting, investment banking, and large technology companies screen for institutional brand most aggressively. After 3–5 years of professional experience, employer surveys indicate that work performance, skills, and professional networks overtake institutional prestige as hiring factors. For most career paths, the difference between a top-20 and top-100 university has minimal long-term impact on earnings or career progression.
Will Asian universities overtake Western universities in rankings?
They already are in specific metrics. Chinese universities lead global publication volume in several STEM fields. NUS and NTU have entered the QS top 15. The University of Tokyo and Seoul National University anchor strong national systems. The question is not whether Asian institutions will compete at the top — they already do — but whether the ranking methodologies, which were designed by and for Western academic traditions, will evolve to capture Asian institutional strengths more accurately. Full parity in composite rankings is projected within 10–15 years for the leading Chinese institutions.
Is it worth attending a top-ranked university?
Research by economists Stacy Dale and Alan Krueger (published in the Quarterly Journal of Economics and updated in subsequent studies) found that students admitted to highly selective universities but who chose to attend less selective institutions earned comparable incomes over their careers. The implication is that student ability, not institutional prestige, drives long-term outcomes for most individuals. Top-ranked universities provide genuine advantages in research access, peer networks, and certain employer pipelines — but these advantages are smaller than rankings marketing suggests and are concentrated in specific career paths.
Final Verdict
The world university rankings 2026 confirm that the global top tier remains dominated by a small cluster of extraordinarily well-funded institutions in the United States, United Kingdom, and Switzerland — but the composition of that cluster is changing. NUS’s consolidation in the top 10, the rapid ascent of Chinese research universities, the surge of Australian institutions through internationalization strategies, and the steady climb of European technical universities collectively signal a redistribution of academic prestige that will accelerate over the next decade.
For prospective students: use these rankings as a starting point, not a destination. Consult subject-specific rankings for your field. Visit campuses. Talk to current students. Evaluate financial aid packages. A university ranked 40th that offers you a full scholarship, strong departmental mentorship, and alignment with your research interests will serve you better than a university ranked 5th where you accumulate debt, struggle to access faculty, and feel isolated.
For policymakers and institutional leaders: the data makes clear that sustained public investment in research infrastructure — exemplified by Switzerland, Singapore, and China — produces measurable ranking outcomes within 10–15 years. Nations that reduce higher education funding should expect their institutions to decline in relative position. Rankings are imperfect instruments, but they track real resource allocation decisions with reasonable fidelity.
For everyone else: the world’s universities are, on the whole, getting better. Global research output is increasing. International collaboration is expanding. Access to higher education is widening, albeit unevenly. The rankings capture a competitive hierarchy, but the underlying story is one of collective advancement. That is worth remembering when the annual ranking announcements inevitably generate headlines about winners and losers.
Last updated: April 2026. Data reflects ranking publications from the 2025–2026 academic cycle. Composite methodology and raw data available upon request.